Introduction
For those of us born in the 90s, we all have been introduced to statistics during school. But little did we know the game-changer that statistics is going to become in the better half of the next century. This is not to say that statistics was not already a game-changer. But the rise of computing power and software has allowed statistics to be used to its full potential. Every year, the power bar actually goes up as we step into the realm we humans never hoped to be on. Perhaps our data collection capabilities have outperformed our computing capabilities. Now that’s like saying we’re back to square one. But that’s a totally different topic. For now, let’s focus on statistics and how it’s being useful to us in data science.
What’s statistics?
Let’s ask the most evident question before going forward. The easiest way to answer it is also the lamest way to do so - Google’s definition.
Statistics is the practice or science of collecting and analysing numerical data in large quantities, especially for the purpose of inferring proportions in a whole from those in a representative sample.
Statistics does include both collecting and analyzing data. In data science, these are independent carrier fields that require their own set of professional skills. These fields complement each other.
Why statistics in data science?
Hopefully, the answer is already obvious. In data science, we deal with population and samples. The population is the whole set of data we are looking to learn while a sample is a subset of the population. A typical data set in a data science project will contain millions of data points. This is far beyond the computing capability of any modern machinery. To compensate for that, we will create a sample from our data set (population). We then use statistical methods in this sample to arrive at a possible conclusion for the whole data set. Sometimes, we might not even know the original population in its entirety. Example: the entire population of a country. But we can take samples from different parts of a country and then use statistics to get an idea about the whole population.
Different types of statistics
There are two types of statistics. One is descriptive statistics while the other is inferential statistics.
-
Descriptive statistics
Descriptive statistics do what it says. It describes the data it has been applied to. So it provides a summary of the data. Descriptive statistics contain two important measures.
- Measure of central tendency
- Measure of variability (spread)
-
Inferential statistics
Inferential statistics is simply used to interpret the meaning of descriptive statistics. So descriptive statistics summaries our data while inferential statistics help us derive meaning from the summarized data. Inferential statistics involves using probability on top of descriptive statistics. We talk more about inferential statistics in a different post.
Measure of central tendency
In data science, it is very important to understand the central tendency of our data. That means, how the data tends to be. The central tendency can be gauged by finding the mean, median or the mode of our data.
Mean
Mean is just the average of all the values in the sample.
Median
Median is the centre value of our data. To find the median, we need to first arrange our data in ascending or descending order. If we have an odd number of data, then the median is the middle value. If we have an even number of data, there will be two middle values. Hence median will be the mean of those two values.
Mode
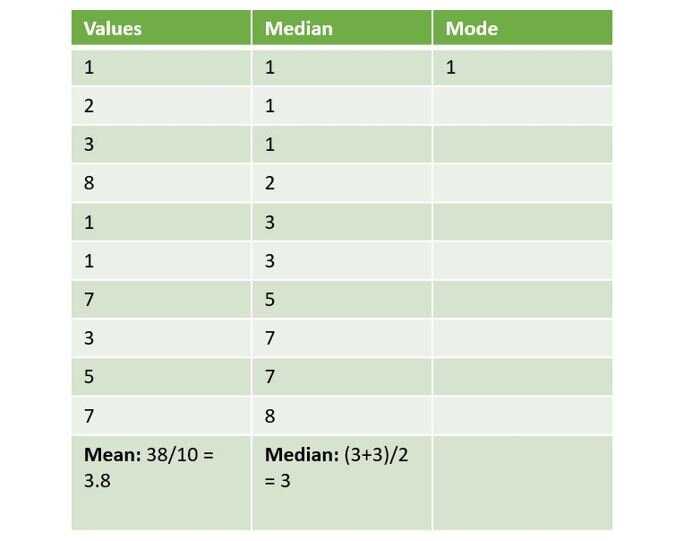
Mode is the most repeating value in the sample set. Mode represents the most popular choice among the population. The below image depicts the mean, median, and mode of a sample set of values.
Measure of variability
The measure of central tendency gives us the center of the data. It will give us how the typical value in our data set looks like. But it is not enough. It is also important to measure how much our data is actually dispersed from that center. Variability can be gauged using methods like Range, Interquartile range, Variance, and Standard deviation.
Range
Range is the entire set of values something can have. The range is the difference between the maximum value and the minimum value.
Interquartile range
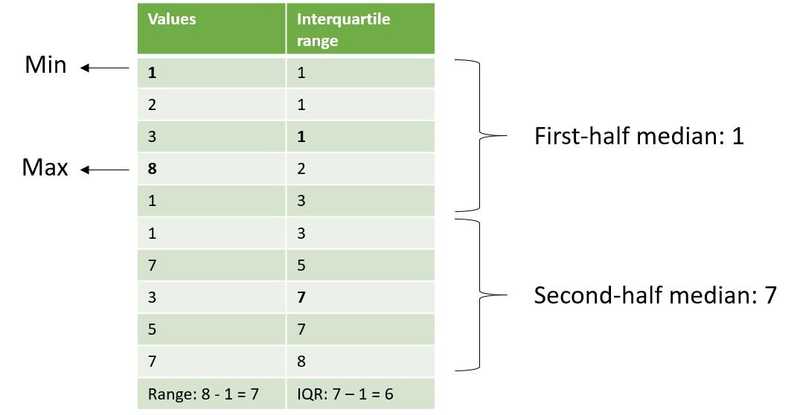
When calculating the interquartile range, we first order our data set in increasing or decreasing order. Then divide our data into four quarters. Then we take the last two values in each quarter and find their mean. The difference between the value of the first quarter and the third quarter is called the interquartile range. They’re are useful to calculate midspread.
In other words, one can say we’re finding the median of the lower and upper half of the data. Then subtracting those medians. The below image depicts the range and interquartile range.
Variance
Variance is used to calculate how much a random variable differs from the average value in the data point. The average value in this sense would be the expected value of the random variable.
S2 = sample variance
xi = the value of the one observation
x̅ = the mean value of all observations
n = the number of observations
Standard deviation
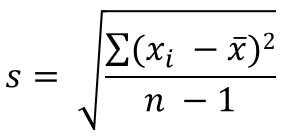
Deviation just means the difference between a selected data point and the average value. Standard deviation can be obtained by just square rooting the variance.
s = standard deviation
n = the size of the sample
xi = each value from the sample
x̅ = the sample mean
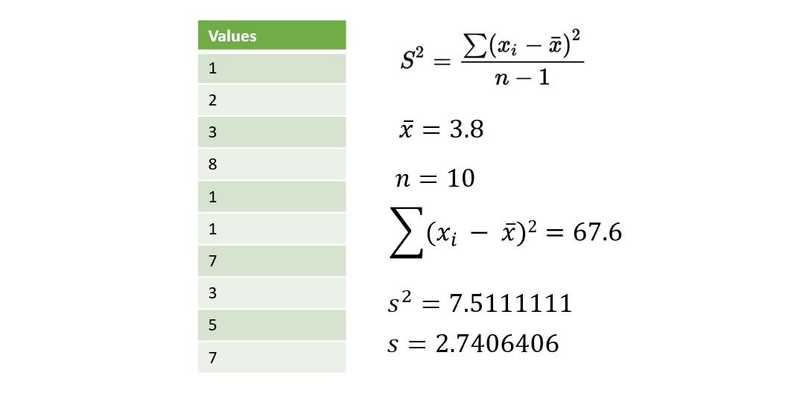
The below image depicts the calculation of variance and standard deviation of a sample of data.
Please note: The above two equation is used for calculating variance and standard deviation of a sample. If one is calculating the variance and standard deviation of a population (which generally don’t occur in data science), replace n-1 with n in the denominator.
Conclusion
In this article, we literally learned some schoolboy statistics. We learned that there are fundamentally two types of statistics - descriptive and inferential. Descriptive statistics help summarize our data while inferential statistics help us extract meaning from that data. There are two important measures in descriptive statistics - the measure of central tendency and the measure of variability. The measures of central tendency include mean, median, and mode while the measures of variability include range, interquartile range, variance, and standard deviation.
There was a time when people underestimated how simple statistics would be detrimental to our daily living. Hopefully, the increasingly mainstream nature of data science will help reduce that. Everything from all walks of life, from our phone to our car to our fridge to our AC has improved because of data science. Statistics plays a major role in data science’s upbringing. Without statistics, data science is just data and no science.


