The confusion matrix is one of the first topics we will come across in data science, more specifically, in machine learning. Although a relatively simple topic, some might find its terminologies a bit difficult. For someone who is totally new, chances are he will also be thinking why a confusion matrix exists at all.
The best way to understand the confusion matrix is through an example. We all have come across this internet captcha system where we have to identify some particular feature (like traffic lights). The captcha is in place to avoid bots. Today we are imagining a program that is used to break the captcha system. By the way, it has already happened. We are not doing any codes, just understanding the concept of the confusion matrix.
We have a captcha with a total of 9 images. These images are either a rabbit or a bird. We’re asked to identify the rabbits in order to pass. But we’re too lazy to do it ourselves, so we let our machine learning algorithm do the job for us. These type of algorithms are called classification algorithms. A classification algorithm classifies the images into one or the other value, or even multiple values.
Out of the 9 images in our captcha, 5 of them are rabbits. While the other 4 are birds. Class 1 represents the rabbits and class 0 represents the birds. The actual arrangement of the figures looks like this.
actual = [1,1,1,1,1,0,0,0,0]Now we let our algorithm predict the images.
prediction = [0,0,1,1,1,1,1,1,0]So our algorithm confused some of the images of rabbits as birds and vice versa. The confusion matrix is a way to visualize this error.
From the above list:
- 2 rabbit images were predicted as birds.
- 3 bird images were predicted as rabbits.
- 4 predictions were accurate. (3 Rabbit and 1 bird)
To visualize this, let’s construct the confusion matrix.
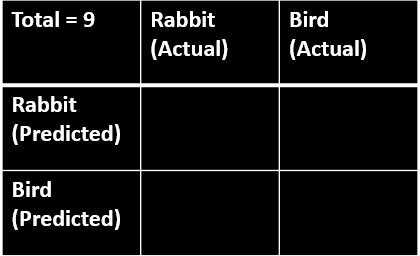
This is the initial template we begin with. There is a total of 9 images, hence total = 9 is shown in the first cell. Then we make space available to write actual rabbit/bird and predicted rabbit/bird counts.
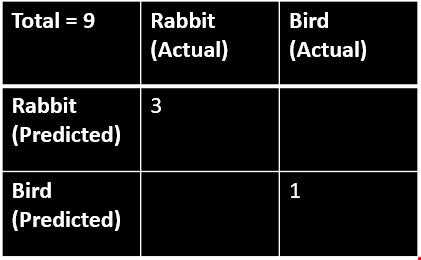
In the diagonal, we write the actual values that were predicted accurately. We know that 3 rabbit images and 1 bird image were predicted accurately.
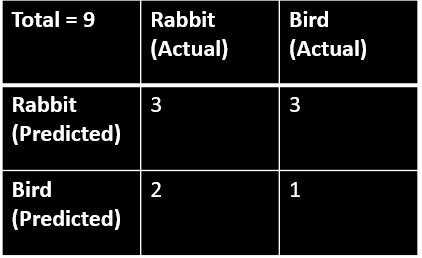
Now we fill the other diagonal with the errored value. We know that 3 bird images were predicted as rabbit and 2 rabbit images were predicted as birds. Those values are filled in the other diagonal. If we got it correct, the sum will be 9 which is the total number of images.
This is how we can read this matrix.
- 3 predicted rabbits were actually rabbit images. (top-left)
- 3 predicted rabbits were actually bird images. (top-right)
- 2 predicted birds were actually rabbit images. (bottom-left)
- 1 predicted bird was actually a bird image. (bottom-right)
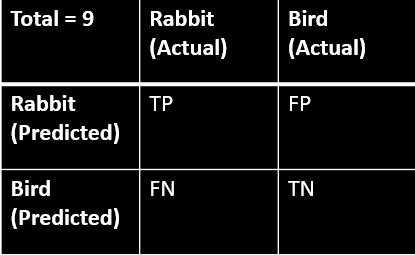
Now let’s represent the confusion matrix in the form of its sensitivity.
TP, FP, FN, and TN stands for true positive, false positive, false negative, and true negative. Keep in mind that the captcha requires us to choose the rabbit images. Hence for the algorithm, identifying the rabbit image will give the true value and identifying a bird image will flag it false.
True Positive: These are values that were predicted to be true and were actually true. (3 images were predicted to be Rabbit(true) and they were actually Rabbit (true) images)
False Positive: These are values that were predicted to be true but were actually false. That is, these images were predicted as Rabbits (true) but the images were actually of birds (false) hence creating a false positive.
False Negative: These are values that are predicted to be false but were actually true. 2 values were predicted to be bird’s (false) but were actually of rabbit’s (true). This creates a false negative.
True Negative: These are values that are predicted to be true but were actually false. Here 1 image was predicted to be a rabbit (true) but the image was actually a bird (false).
The confusion matrix, ironically, is quite confusing for the first time learner. Feel free to re-read until the concept is well understood.
Calculating the accuracy of our algorithm
With TP, TN, FP, and FN numbers, we can calculate many things. But most importantly the accuracy of our algorithm. The equation for calculating accuracy is simple and self-explanatory.
TP and TN are values that were correctly predicted. TP is the number of correctly predicted rabbit images while TN is the number of correctly predicted bird images. The denominator represents the total number of images. Substituting the values, we will get.
Hence, our algorithm has 66.67% accuracy.
The fallacy in accuracy calculation
Let’s assume the total number of images we have is 100. Out of the 100 images, 95 of those are rabbits, while 5 of them are birds. We got an accuracy of 95%. At one glance, this looks amazing. But we can receive a 95% accuracy if the rabbits had a 100% recognition rate and the birds have a 0% recognition rate. While the 95% value might lead us to think our algorithm is running efficiently, we could have 0% efficiency in detecting birds. This problem arises when we have a highly unbalanced data set.
Matthews correlation coefficient
As already mentioned above, directly calculating accuracy can be deceiving when the data set is unbalanced. Matthews correlation coefficient brings about a balanced approach to evaluate the confusion matrix.
As we can see from the equation, both the numerator and denominator are affected by TP, FP, TN, and FN. When calculating accuracy, the numerator was fully determined by true values. If an unbalanced data set was present, it will easily create bias in the numerator. MCC provides a more balanced approach in this regard.
Conclusion
A confusion matrix is a method or technique to summarize the performance of our machine learning (classification) algorithm. We have seen how to calculate the accuracy of our algorithm. We also learned that accuracy can be deceiving provided the data set is unbalanced. Matthews correlation coefficient (MCC) is a more balanced approach to evaluate our confusion matrix.


